Integrating Mikrotik with Suricata IDS/IPS for Network Security
A comprehensive guide to setting up Mikrotik-Suricata integration for real-time threat detection and prevention
Introduction
Network security has always been a moving target. As threats become more sophisticated, the tools we use to defend our networks need to evolve as well. Recently, I’ve been looking for a way to enhance the security of my home and small business networks without breaking the bank on expensive commercial solutions. After some research and experimentation, I’ve put together what I believe is an elegant solution that combines the power of Mikrotik routers with Suricata, one of the most capable open-source intrusion detection systems available.
In this article, I’ll walk you through setting up Mikrocata2SELKS, a solution I’ve been using to monitor network traffic, detect suspicious activities, and automatically block potential threats. What makes this setup particularly appealing is that it leverages the TZSP protocol to mirror traffic from Mikrotik routers to a dedicated analysis machine running Suricata, all without affecting the performance of your network.
Let me take you through the entire process from installation to configuration, sharing the insights I’ve gained along the way. Whether you’re a network administrator, a security enthusiast, or just someone looking to add an extra layer of protection to your network, I think you’ll find this guide valuable.
Understanding the Components
Before diving into the installation process, let’s take a moment to understand the key components of our system:
Mikrotik Router
At the heart of our setup is the Mikrotik router. I’ve found Mikrotik devices to be an excellent choice for this purpose due to their powerful features and impressive price-to-performance ratio. For this setup, we’ll be using the router’s sniffer tool to capture and stream network traffic to our analysis machine.
TZSP Protocol
TZSP (TaZmen Sniffer Protocol) is what allows us to mirror traffic from the Mikrotik router to our analysis server. It’s a relatively lightweight protocol that encapsulates packets for transport over a network, making it perfect for our monitoring needs without bogging down our router.
Suricata IDS/IPS
Suricata is a high-performance network IDS, IPS, and network security monitoring engine. It’s what will analyze our traffic, detect potential threats, and generate alerts. In my experience, Suricata offers an excellent balance between detection capabilities and performance.
SELKS
SELKS (Suricata, Elasticsearch, Logstash, Kibana, Scirius) is a Debian-based distribution that bundles these tools together for network security monitoring. In our setup, we’ll be using a containerized version of SELKS for easier deployment and maintenance.
Mikrocata2SELKS
https://github.com/angolo40/mikrocata2selks
This is the glue that ties everything together. Mikrocata2SELKS is a Python-based application that bridges Suricata with Mikrotik’s API, allowing for automated blocking of malicious IP addresses.
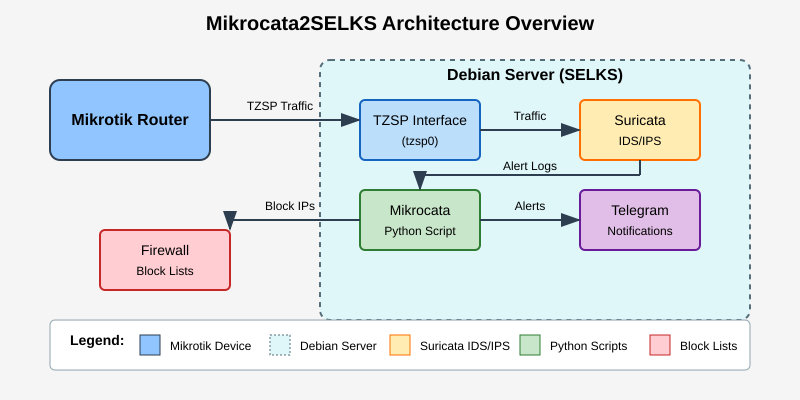
Figure 1: High-level architecture of the Mikrocata2SELKS system showing traffic flow from Mikrotik devices through Suricata IDS/IPS
System Requirements
Before we begin, let’s make sure you have the necessary hardware. Based on my testing, you’ll need:
- A Mikrotik router with an active internet connection
- A dedicated machine (physical or virtual) running Debian 12
- At least 4 CPU cores for the Debian machine
- A minimum of 10GB RAM
- At least 10GB of free disk space (though I’d recommend 200GB+ SSD for production use)
In my setup, I’m using a Mikrotik RB4011 as my router and a virtual machine with 4 cores and 12GB of RAM for the analysis server. This has been more than sufficient for a small business network with moderate traffic.
Installation Process
Now, let’s get to the fun part – setting up our system. I’ll break this down into manageable steps.
Step 1: Prepare the Debian Machine
First, we need a fresh installation of Debian 12. Once you have that up and running, log in as root and install Git:
apt install gitNext, clone the Mikrocata2SELKS repository:
git clone https://github.com/angolo40/mikrocata2selks.gitThis repository contains all the scripts and configuration files we’ll need for our setup.
Step 2: Configure the Easy Install Script
Navigate to the cloned repository and take a look at the easyinstall.sh script. This script automates most of the installation process, but we need to make a few adjustments to fit our environment:
cd mikrocata2selksOpen the script with your favorite text editor:
nano easyinstall.shThere are a few important settings you might want to adjust:
# Path where to install SELKS files
PATH_SELKS=$HOME/SELKS

# SETUP CONFIG SCRIPT
INSTALL_DUMMY_INTERFACE=true
INSTALL_MIKROCATA_SERVICE=true
INSTALL_SELKS=true

HOW_MANY_MIKROTIK=1  #Min 1 Mikrotik
The PATH_SELKS variable determines where the SELKS files will be installed. I typically leave this as the default unless I have a specific reason to place it elsewhere.
The configuration flags control which components get installed. In most cases, you’ll want to leave all three set to true.
The HOW_MANY_MIKROTIK variable is interesting – it allows you to set up monitoring for multiple Mikrotik devices. If you’re managing several networks or have a more complex setup with multiple routers, you can increase this number. For my home setup, I just kept it at 1.
Once you’ve adjusted these settings to your liking, save the file and exit the editor.
Step 3: Run the Installation Script
Now it’s time to execute the script:
./easyinstall.shThis script will perform several actions:
- Install required packages (Docker, Python, and various dependencies)
- Create a dummy network interface for receiving TZSP traffic
- Set up the Mikrocata service to communicate with the Mikrotik router
- Install the SELKS container stack for analysis
The process might take a while, especially the SELKS installation part. In my experience, it typically takes around 15-20 minutes on a system with decent internet connectivity. This is a good time to grab a coffee or catch up on emails.
Step 4: Configure the Mikrocata Script
Once the installation completes, we need to edit the Mikrocata script to include our specific Mikrotik and Telegram parameters:
nano /usr/local/bin/mikrocataTZSP0.pyFind the section marked with “START EDIT SETTINGS” and update the following parameters:
#Set Mikrotik login information
USERNAME = "mikrocata2selks"
PASSWORD = "password"  # Replace with your actual password
ROUTER_IP = "192.168.0.1"  # Replace with your Mikrotik's IP
TIMEOUT = "1d"
USE_SSL = False  # Set to True if you want to use SSL for the API connection
PORT = 8728  # Default port for non-SSL connection
BLOCK_LIST_NAME = "Suricata"

#Set Telegram information
enable_telegram = False  # Set to True if you want Telegram notifications
TELEGRAM_TOKEN = "TOKEN"  # Your Telegram bot token
TELEGRAM_CHATID = "CHATID"  # Your Telegram chat ID

# You can add your WAN IP, so it doesn't get mistakenly blocked
WAN_IP = "yourpublicip"  # Replace with your actual public IP
LOCAL_IP_PREFIX = "192.168."  # Your local network prefix
I’ve found that configuring the Telegram notifications is particularly useful, as it allows me to get real-time alerts about potential threats without having to check the dashboard constantly. Of course, this is optional, and you can leave it disabled if you prefer.
The WHITELIST_IPS variable is also important, as it ensures that critical IPs like your WAN address, DNS servers, and local network don’t get accidentally blocked. I always make sure to include my ISP’s DNS servers here as well.
Another important setting is the SEVERITY parameter:
#Set comma separated value of suricata alerts severity which will be blocked
SEVERITY=("1","2")
This determines which alert levels from Suricata will trigger an IP block. Severity 1 is the most critical, while 3 is the least. I typically stick with 1 and 2 to avoid too many false positives.
Once you’ve made your changes, save the file and restart the Mikrocata service:
systemctl restart mikrocataTZSP0.serviceStep 5: Configure Your Mikrotik Router
Now, we need to set up the Mikrotik router to send traffic to our analysis server. SSH into your Mikrotik or use Winbox to connect, and run the following commands:
First, enable the sniffer with streaming:
/tool/sniffer/set filter-stream=yes streaming-enabled=yes streaming-server=[YOUR_DEBIAN_IP]:37008
/tool/sniffer/start
Replace [YOUR_DEBIAN_IP] with the IP address of your Debian server.
Next, add firewall rules to block traffic from malicious IPs:
/ip/firewall/raw/add action=drop chain=prerouting comment="IPS-drop_in_bad_traffic" src-address-list=Suricata
/ip/firewall/raw/add action=drop chain=prerouting comment="IPS-drop_out_bad_traffic" dst-address-list=Suricata
If you’re using IPv6, add these rules as well:
/ipv6/firewall/raw/add action=drop chain=prerouting comment="IPS-drop_in_bad_traffic" src-address-list=Suricata
/ipv6/firewall/raw/add action=drop chain=prerouting comment="IPS-drop_out_bad_traffic" dst-address-list=Suricata
Finally, enable the Mikrotik API and create a user for Mikrocata to connect:
/ip/service/set api address=[DEBIAN_IP]
/user/add name=mikrocata2selks password=your_secure_password group=full
Replace your_secure_password with a strong password (and make sure it matches what you set in the Mikrocata script).
If you prefer a more secure connection, you can use SSL instead:
/ip/service/set api-ssl address=[DEBIAN_IP]Remember to update the USE_SSL option in your Mikrocata configuration if you choose this approach. In my production environments, I always use SSL, but for home use, the regular API connection is often sufficient.
Verifying the Setup
Now that everything is installed and configured, let’s make sure it’s working correctly.
Check if Traffic is Being Received
To verify that packets are arriving at your Debian VM from the Mikrotik router through the dummy interface, run:
tcpdump -i tzsp0You should see a stream of packets being captured. If you don’t see any traffic, double-check your Mikrotik sniffer configuration.
Check Service Status
Verify that the Mikrocata service and TZSP interface are running:
systemctl status mikrocataTZSP0.service
systemctl status TZSPreplay37008@tzsp0.service
Both services should show as “active (running)”. If either service is not running, check the logs for error messages:
journalctl -u mikrocataTZSP0.service -fCheck Suricata Container
Make sure the Suricata Docker container is running:
docker logs -f suricataYou should see logs showing Suricata starting up and processing traffic. If you encounter an error message like ‘Fatal glibc error: CPU does not support x86-64-v2’ and you’re running under Proxmox VE, you’ll need to set the CPU processor type to HOST in your VM settings.
Access the SELKS Dashboard
The SELKS dashboard provides a graphical interface for monitoring alerts and analyzing traffic. You can access it by navigating to:
https://[YOUR_DEBIAN_IP]The default login credentials are:
- Username:
selks-user - Password:
selks-user
I strongly recommend changing these credentials after your first login for security reasons.
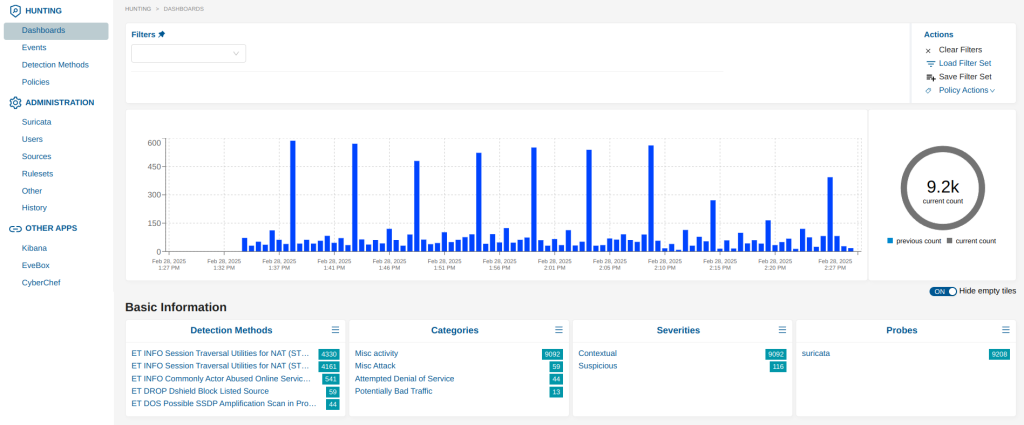
Figure 2: The SELKS dashboard showing alert statistics and network traffic analysis
Understanding the Mikrocata Script
The Mikrocata Python script is the heart of our integration. Let’s examine its key components:
Event Monitoring
The script uses the pyinotify library to monitor the Suricata log file (eve.json) for changes:
def process_IN_MODIFY(self, event):
    if event.pathname == FILEPATH:
        try:
            add_to_tik(read_json(FILEPATH))
        except ConnectionError:
            connect_to_tik()
This watches for new alerts in real-time without constant polling.
Using filesystem events is more efficient than periodically checking the file.
Alert Processing
When new alerts are detected, they’re parsed and evaluated:
def add_to_tik(alerts):
    # ... (initialization code)

    # Remove duplicate src_ips.
    for event in {item['src_ip']: item for item in alerts}.values():
        if str(event["alert"]["severity"]) not in SEVERITY:
            print("pass severity: " + str(event["alert"]["severity"]))
            break

        # ... (more processing)
This code extracts the relevant information from alerts and determines which IPs to block.
The deduplication ensures we don’t process the same IP multiple times, and the severity check allows us to filter out less critical alerts.
Mikrotik Integration
The script communicates with the Mikrotik router via the RouterOS API:
def connect_to_tik():
    global api

    # Determine which port to use
    actual_port = 8729 if USE_SSL else 8728

    while True:
        try:
            if USE_SSL:
                # SSL connection setup
                # ... (SSL context setup)
                api = connect(username=USERNAME, password=PASSWORD, host=ROUTER_IP,
                            ssl_wrapper=ctx.wrap_socket, port=actual_port)
            else:
                # Plain connection without SSL
                api = connect(username=USERNAME, password=PASSWORD, host=ROUTER_IP,
                            port=actual_port)
            print(f"[Mikrocata] Connected to Mikrotik")
            break
Establishes a secure connection to the router’s API.
This approach allows for programmatic manipulation of the router’s configuration, enabling automatic blocking.
Persistence Across Reboots
The script maintains persistent state across reboots:
def check_tik_uptime(resources):
    # ... (uptime calculation code)

    if total_seconds < bookmark:
        return True

    return False
Detects when the router has rebooted and reloads previously defined blocks.
This ensures that security policies persist even if the router is restarted.
Handling Multiple Mikrotik Devices
One of the features I’ve come to appreciate about this setup is the ability to monitor multiple Mikrotik devices from a single Debian server. If you configured the HOW_MANY_MIKROTIK variable to be greater than 1 in the easyinstall.sh script, the system will have created multiple dummy interfaces and corresponding Mikrocata services.
For example, if you set HOW_MANY_MIKROTIK=3, you’ll have:
tzsp0interface on port37008and the script/usr/local/bin/mikrocataTZSP0.pytzsp1interface on port37009and the script/usr/local/bin/mikrocataTZSP1.pytzsp2interface on port37010and the script/usr/local/bin/mikrocataTZSP2.py
You’ll need to edit each script with the specific Mikrotik values and enable the sniffer on each Mikrotik device to send data to the corresponding port. I’ve found this approach to be particularly useful for managing networks across multiple locations, giving me a centralized view of security events.
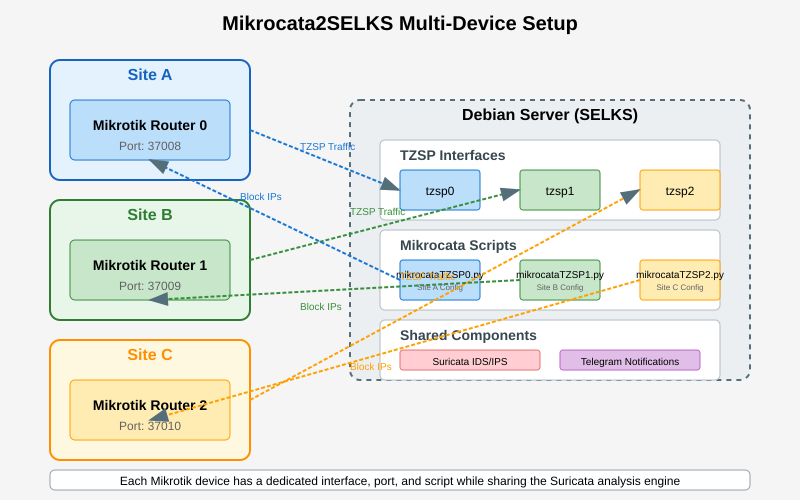
Figure 3: Diagram showing how Mikrocata2SELKS scales to monitor multiple Mikrotik devices in different network segments
How It All Works Together
Now that we have everything set up, let’s take a step back and understand how all these components work together:
- The Mikrotik router captures network traffic and streams it via TZSP to our Debian server.
- The TZSP traffic is received by the dummy interface (tzsp0) on the Debian server.
- The TZSPreplay service passes this traffic to the Suricata container for analysis.
- Suricata examines each packet against its ruleset and logs alerts to the eve.json file.
- The Mikrocata script monitors this log file for new alerts.
- When a malicious IP is detected, Mikrocata adds it to the Suricata address list on the Mikrotik router.
- The Mikrotik router blocks all traffic to/from the malicious IP based on its firewall rules.
- If configured, Telegram notifications are sent for each blocked IP.
It’s a simple yet effective setup that provides real-time protection against many common network threats. The beauty of this system is that it can detect and block malicious traffic without any manual intervention.
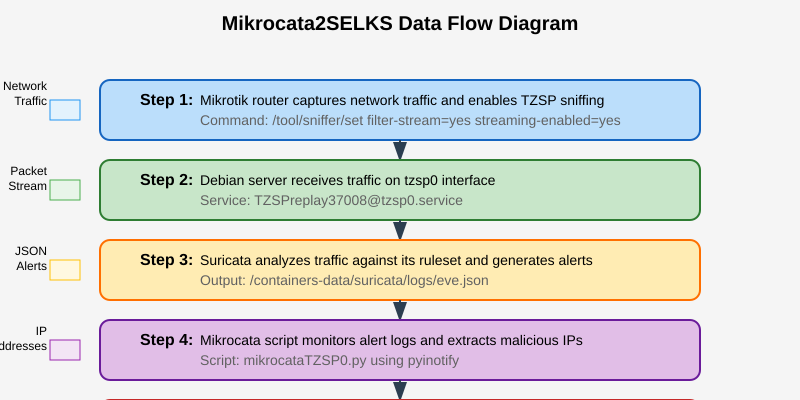
Figure 4: Data flow diagram showing how traffic moves from Mikrotik through Suricata for analysis and back to Mikrotik for enforcement
Troubleshooting Common Issues
If you encounter problems, here are some troubleshooting steps:
Check Packet Reception
Verify that packets are arriving from your Mikrotik:
tcpdump -i tzsp0This confirms that traffic is being received on the dummy interface.
If no packets are visible, the problem likely lies with the Mikrotik configuration or network connectivity.
Verify Service Status
Check if the Mikrocata service is running:
systemctl status mikrocataTZSP0.service
systemctl status TZSPreplay37008@tzsp0.servicePurpose: These commands show whether the services are active and running.
Motivation: Services might fail to start due to configuration errors or dependencies.
Inspect Docker Containers
Check if the Suricata container is functioning:
docker logs -f suricataShows the live log output from the Suricata container.
This can reveal issues with rule loading, traffic processing, or resource constraints.
Common Pitfalls
- CPU Compatibility Issues: If Suricata shows ‘Fatal glibc error: CPU does not support x86-64-v2’ and you’re using Proxmox, set the CPU processor type to HOST in the virtual machine settings.
- Connection Problems: If Mikrocata can’t connect to your router, check:
- IP address correctness
- API service status on the router
- Firewall rules that might block the connection
- Username/password accuracy
- No Alerts Generated: If everything seems to be working but no alerts appear:
- Verify that traffic is indeed flowing through the monitored interfaces
- Check that Suricata rules are properly loaded and enabled
- Ensure the severity levels in Mikrocata match your expectations
Limitations
Building a secure network is like assembling a puzzle — IPS/IDS is just one piece, SSL inspection another. Without SSL proxy functionality, Suricata’s visibility into encrypted traffic is limited primarily to metadata analysis and JA3/JA3S fingerprinting. Even pfSense doesn’t perform SSL inspection by default.
Compared to pfSense, however, MikroTik lacks built-in IPS/IDS capabilities entirely. This solution aims to add this missing piece for MikroTik users, addressing a fundamental gap in the platform’s security toolkit. Despite limitations with encrypted traffic, this implementation still offers significant value through complete analysis of unencrypted traffic, network anomaly detection, TLS fingerprinting, automated blocking of malicious IPs, and real-time alerts for suspicious activities.
For home networks and small businesses using MikroTik equipment, these capabilities represent a substantial security improvement with minimal investment. In the next article of this series, we’ll take things further by exploring SSL inspection integration, which will enhance Suricata’s visibility into encrypted traffic and expand its detection capabilities.
Conclusion
Mikrocata2SELKS offers a powerful, flexible solution for network security monitoring and automated threat response. By combining the robust packet handling capabilities of Mikrotik routers with the advanced threat detection of Suricata, this system provides enterprise-grade protection that’s achievable even with modest resources.
The Mikrotik-Suricata integration we’ve built offers:
- Real-time visibility into network threats and suspicious activities
- Automated response to block malicious traffic without manual intervention
- Scalability to handle multiple network segments and devices
- Persistence of security policies across system reboots
- Customizability to adapt to your specific security requirements
While setting up such a system involves multiple components and configurations, the automation provided by the installation script simplifies the process significantly. The result is a comprehensive security monitoring solution that continually protects your network from evolving threats.
Additional Resources
- Suricata Official Documentation
- Mikrotik RouterOS Manual
- SELKS Documentation
- TZSP Protocol Information
Support the Project
If you found this Mikrocata2SELKS solution helpful, consider supporting the project:
- Give it a star on GitHub: Mikrocata2SELKS
- Contribute bug reports or feature enhancements
- Share your experiences and improvements with the community
For those who wish to support the development financially, donations are accepted at the XMR address provided in the project’s README.
Comments
-
Chris
I have 3 router, all connected via WireGuard VPN.
Main router (R1) 172.30.1.x/24
SELKS: 172.30.x.218
WireGuard: 10.69.x.0/24
Router 2 (R2:) 192.168.88.x/24 (WG_Int: 10.69.x.11)
Router 2 (R3): 192.168.2.0/24 (WG_int: 10.69.x.101)Main router runs fine and send traffic to SELKS.
R2 and R3 are configured as per the guide however the moment you start sniffer /tool/sniffer/start, both Mikrotik instantly experience DoH server error as shown below and DoH resumes working once sniffer if stopped:
DoH server connection error: SSL: internal error (6)
DoH server connection error: Idle timeout – connecting
DoH server connection error: Idle timeout – connecting [ignoring repeated messages]
DoH server connection error: SSL: handshake timed out (6) -
Giuseppe
Hello, did u add your DOH servers in whitelistip?
Activating packet sniffer doesn’t modify packet routing.
Try to enable packet sniffer and disable blocking Suricata list on firewall and
Let me know what’s appended. -
Chris
@Giuseppe
DoH servers IP added to whitelist.
Both IPv4 and v6 suricata blocking disabled but same issue.
DoH error when packet sniffer enabled -
Giuseppe
Okay.
The Suricata blocked list is the only interaction between your MikroTik and SELKS, so with the lists disabled, the problem should be on your MikroTik side.
But it is difficult for me to help you without watch your configuration.
Which MikroTik are you using? OS version?-
-
Chris
No solutions yet. Only running it on the main router but not remote ones
-
-
-
Chris
@Guiseppe
I certainly think the issue is MikroTik playing up once packets sniffer is started. Just not sure what the issue is…
I am using MikroTik model = RB5009UG+S+ with version 7.18 -
Fabio
Hi,
I have created a Debian 12 server, installed and configured according to the guide, but I’m facing an issue I can’t resolve. Specifically, I’ve added the PAW Patrules source and imported the rules correctly. In both EveBox and Suricata, the rules are shown with severity 1, but despite this, I don’t see any drop action being applied on the MikroTik. This issue does not occur with other rules, such as those from ETOpen.
How can I resolve this?
Thank you. -
Giuseppe
Hello Fabio,
can u please tell me:1. What’s the output of `systemctl status mikrocataTZSP0.service` when a PAW rule is triggered? This will help see if the service is running properly and detecting the alerts.
2. Can you paste some portions of the Suricata log where a PAW rule is being triggered? I’m particularly interested in the alert format and any differences between PAW and ETOpen rule alerts.
I suspect that mikrocataTZSP0.service is not able to read correctly the Suricata output logs for these particular rules, possibly due to a formatting difference or a specific field that’s missing or different in the PAW rules output.
I also suggest you open an issue in the GitHub repository with these details, so I can look into implementing a proper fix if needed.
-
Fabio
Hi Giuseppe, as suggested, I opened an issue in the GitHub repository.
Thank you very much. -
Vaclav
Hi Giuseppe, thank you for your effort with this integration it is cool and working like a charm.
Only question could it be modified to use port mirroring instead of packet sniffer? It can save a lot of resources on MikrotikThank you
Vaclav -
Vaclav
Hi Giuseppe, could be possible to adapt integration to use port mirroring instead of packet sniffer?
Thank you
Vaclav -
Ivan
I connected everything according to the instructions, and the traffic is flowing (tcpdump shows a huge stream of packets), but hunting receives much less traffic than tcpdump.
-
Giuseppe
Hello, hunting is based on suricata severity 1,2 or 3 so depends on what suricata intercept.
So in general it’s normal because not all traffic is recognized as dangerous by suricata
-
-
Tent
You need to do logrotate for the files: eve.json, stats.log, suricata.log?


Ilya
It’s a cool project
, but I couldn’t add a template because it doesn’t include Kibana.
Configure the module
edit
You can further refine the behavior of the suricata module by specifying variable settings in the modules.d/suricata.yml file, or overriding settings at the command line.
This is an example of how to overwrite the default log file path.
https://www.elastic.co/guide/en/beats/filebeat/7.17/filebeat-module-suricata.html#suricata-settings
===============
– module: suricata
eve:
enabled: true
var.paths: [“/my/path/suricata.json”]
I can see the data coming into Suricata, but it
doesn’t process it or detect it.
The data in EveBox is Flow only